RDS has been tracking various aspects of the real estate industry through our Tableau workbook, Econometrix.
Following is an updated look at the U.S. real estate market based on the most recent data available.
MORTGAGE RATES
Not surprisingly, the U.S. real estate market continues to be strong, fueled by still, historically-low mortgage rates.
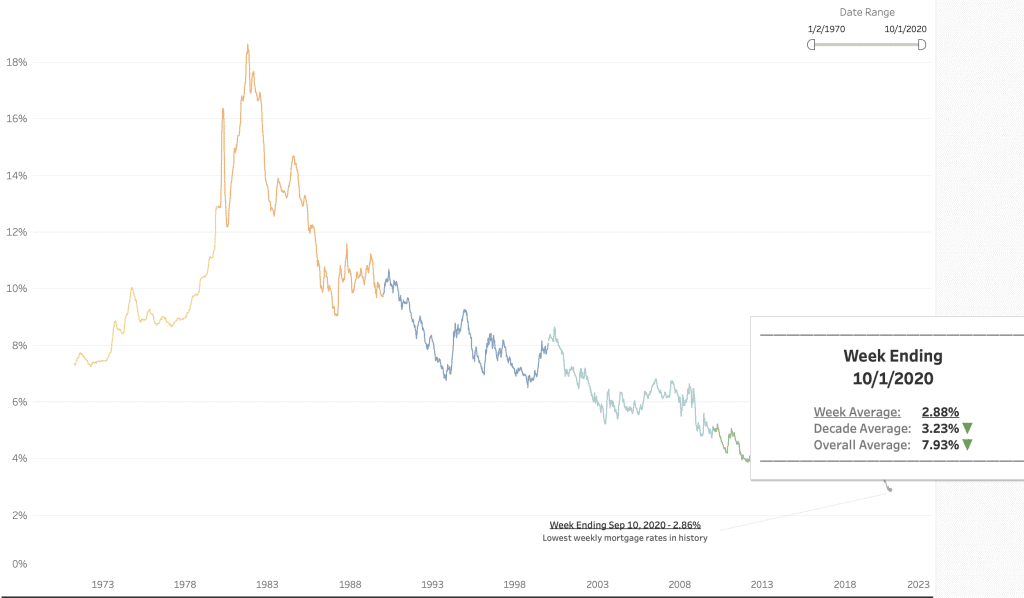
As of October 1, the 30-year fixed mortgage rate is 2.88%, holding steady from the previous week’s 2.90%. October’s 30-year fixed rate is down 21% from a year ago.
For context, the average 30-year fixed rate during the decade of 2010, to date, is 3.25%. Dating back to the first year of our analysis, 1971, the average 30-year fixed rate is 7.93.
As we look to the future, mortgage rates are expected to remain low through 2021, and beyond. Of course, much depends on the course of the coronavirus pandemic and its impact on economic recovery. A robust recovery in 2021 will obviously drive up mortgage rates. In a recent Bankrate.com article, Lynn Reaser, Chief Economist at Point Loma Nazarene University in San Diego said: “Mortgage rates are likely to move up one-quarter to one-half a percentage point by mid-2021, taking them to 3.5 percent to 3.75 percent, particularly if a vaccine becomes available, allowing the economic recovery to pick up speed.”
30 Year Fixed Mortgage Rate
CLICK HERE to see the mortgage rate trend viz.
Fueled by these low mortgage rates, home sales, along with applications for new and refinance mortgages remain healthy.
NEW HOME SALES
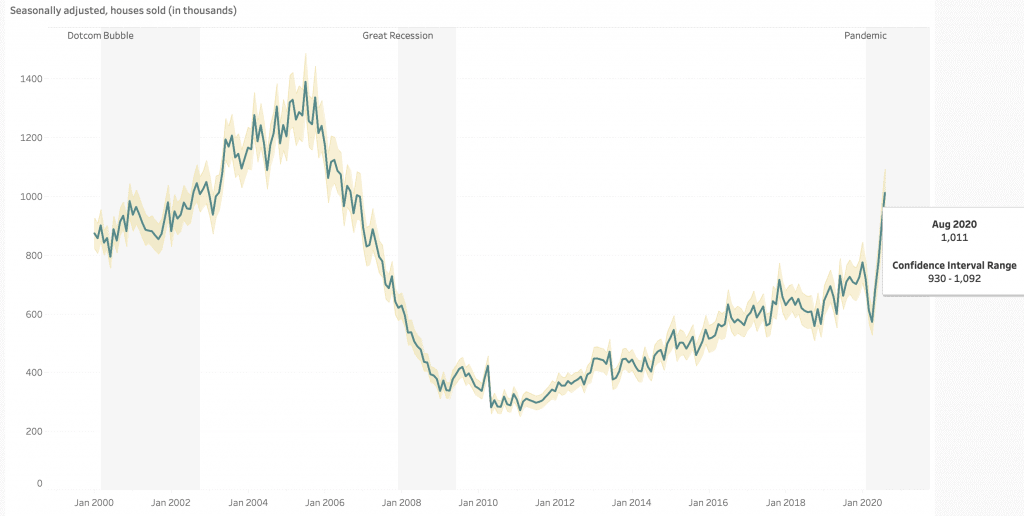
Seasonally-adjusted monthly home sales hit 1,011,000 in August, a 12% increase versus July’s level of 901,000, and a 43% increase versus year ago. August’s home sales marked the highest level since the 4thquarter of 2006.
Since hitting a two-year low of 571,000 in April, monthly home sales up 77% through the end of August.
New Home Sales Trends
CLICK HERE to see the home sales trend viz.
MORTGAGE APPLICATIONS
The Mortgage Bankers Association (MBA) reports weekly on two types of mortgage applications:
- MBA Purchase Index: The Purchase Index is a leading indicator of home sales by 4-6 weeks, meaning that it is a predictor of housing activity. Housing economists and home builders use the index to forecast new and existing home sales.
- MBA Refinance Index: The Refinance Index is a tool to predict mortgage activity. Homebuilders pay attention to the Refinance Index because it is a leading indicator of home sales. On the other hand, mortgage investors also take notice of the index as it is a leading indicator of mortgage pre-payment activity.
MBA Purchase Index
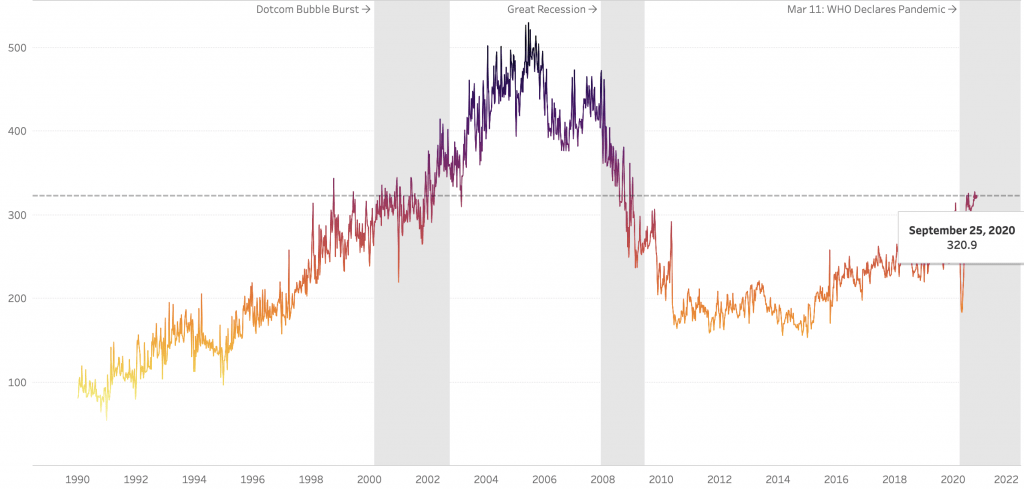
The year started strong, with the Purchase Index climbing past 300 (313.7) for the first time since October, 2009.
After dropping to 182.6, the Purchase Index has risen and now sits at 320.9 as of September25. The index has stayed in the 300 range since mid-summer.
Versus the same time a year ago, the Purchase Index of 317.7 is up 59%.
Mortgage Application Trends
CLICK HERE to see the mortgage application trend viz.
MBA Refinance Index
Also, as a response to record-low interest rates, the refinance market has had a wild ride in the first seven months of 2020.
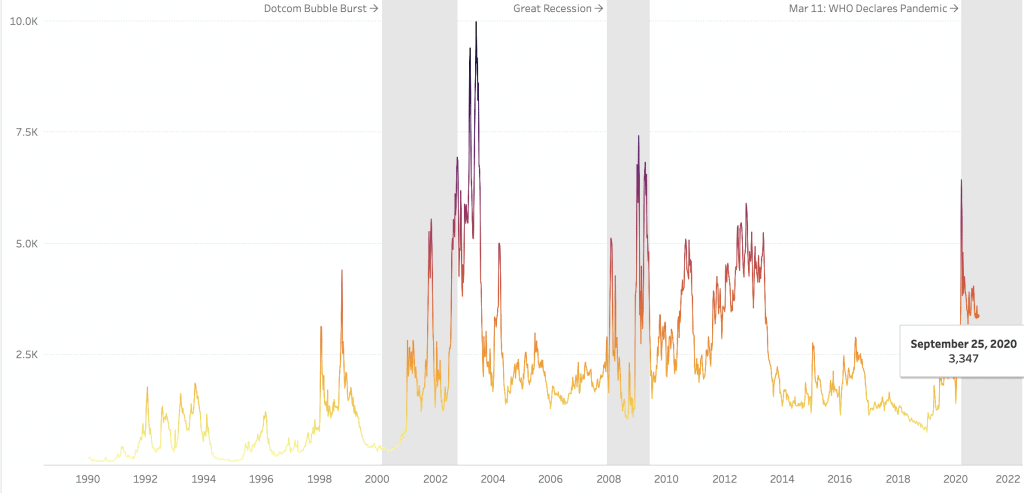
Refinance activity has been on an upward swing since the Refinance Index hit an 18-year low in 2018. The Index grew 71% in 2019 and is on pace to grow another 108% through 2020. But as you can see from the screenshot below, the Index has been on a wild ride since the first of the year, hitting an 11-year high of 6,419 on March 6th (a 479% increase versus the same date a year ago).
The Index currently stands at 3,347, a 52% increase from the same date a year-ago.
Mortgage Refinance Trends
CLICK HERE for mortgage refinance trend Viz.
SOURCE