Much is being written today with regard to Millennials and money management, as studies abound to explain the behavior of this generation and how their views on money differ from their elders.
Type the phrase ‘millennials are killing . . .’ into Google search and predictive text offers answers that include killing banks, fast food chains, home ownership, the housing industry and the diamond industry, among others.
But reports from the Federal Reserve Bank of St. Louis provide evidence that the financial habits of the Millennial generation are unfairly maligned. In one study, the Fed compared savings and net worth of Millennials (those born between 1981-1996) with Generation X (1965-1980), and in the other, took a look at generational differences in credit card debt.
THE BIG PICTURE
Using the Survey of Consumer Finances, the Fed found factors that account for Millennials holding fewer overall assets than Gen X did at a comparable life stage in 2001. As seen in the graph below, Millennials hold average assets of $162,000 compared to the $198,000 average of Gen X in 2001.
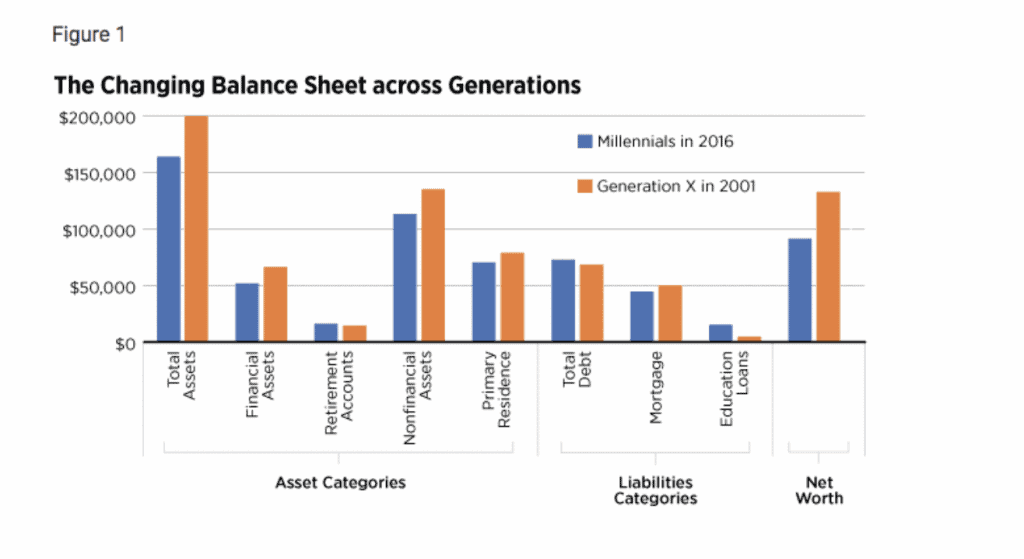
The reduction occurred in both financial and nonfinancial assets. The average financial asset position was around $15,000 lower than in 2001, dropping from $65,000 to $50,000. The reduction of nonfinancial assets was $22,000, dropping from $133,000 to $111,000.
Part of the reduction of the nonfinancial asset position occurred in housing. Millennials held an average of $69,000 in their primary residence, while Gen Xers held an average of $78,000. While Millennials held lower levels of assets on average, they had a slight advantage in average retirement account balance, at $15,500 relative to Gen X’s $13,600.
Millennials held a slightly higher level of total debt, at an average of $72,000 compared to Gen X’s average of $67,000. While the average levels of debt were similar across the two generations, the composition was markedly different. Average student loan levels surged from $4,200 for Gen X to $14,700 for Millennials. Because of the smaller average value of housing assets for Millennials, the level of mortgage debt was also smaller at $43,000 compared to $49,000 for Gen X.
ROBUSTNESS CHECK
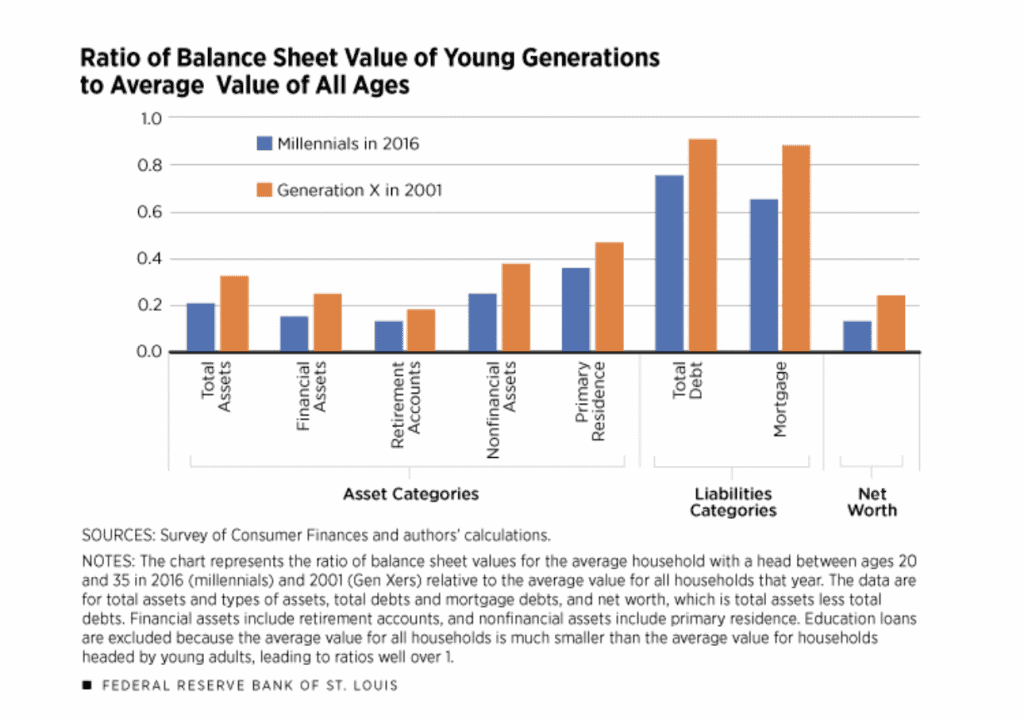
The SCF adjusted the dollar values for inflation to account for price changes in asset categories from 2001-2016 but the adjustment still doesn’t account for the difference in relative prices of asset categories. Thus, analysts from the Fed conducted a robustness check, computing the ratio of average value for both generations studied and comparing to the average of all households in 2001 and 2016.
These ratios are best interpreted as a percentage of the average value for all households. For example, a ratio of 0.2 indicates that the generation in question held assets or liabilities equal to 20 percent of the average value across all households in that year.
The orange bar in the total assets category of the figure below represents the ratio of the average total assets of Gen X to those of all households in 2001, while the blue bar represents a similar ratio for Millennials in 2016.
In this relative measure, Millennials had a significantly smaller asset ratio (21 percent) than Gen Xers (32 percent). The financial assets, nonfinancial assets and housing ratios for Millennials each dropped about 10 percentage points, and the retirement account ratio fell by about 5 percentage points.
ABOUT DEBT
But, while holding fewer assets, Millennials also have a lower average debt ratio. While this generation has significantly higher student loan debt than preceding generations, it also carries significantly lower credit card debt; Millennial consumers average unpaid card balances of $1,800 while Gen Xers average $2,700.
The Fed also found Millennials are better about paying back debt than they get credit for. Millennials’ delinquency rates on credit card payments are almost five points less than Gen Xers and Baby Boomers have the highest rate of delinquency by a slim margin.
Debt delinquency tends to be most common in youth, regardless of the generation. So, while a face-to-face comparison of delinquency by generations initially gives Boomers the edge, the graph below takes life cycle into account and plots data to show the age at which delinquency occurred.
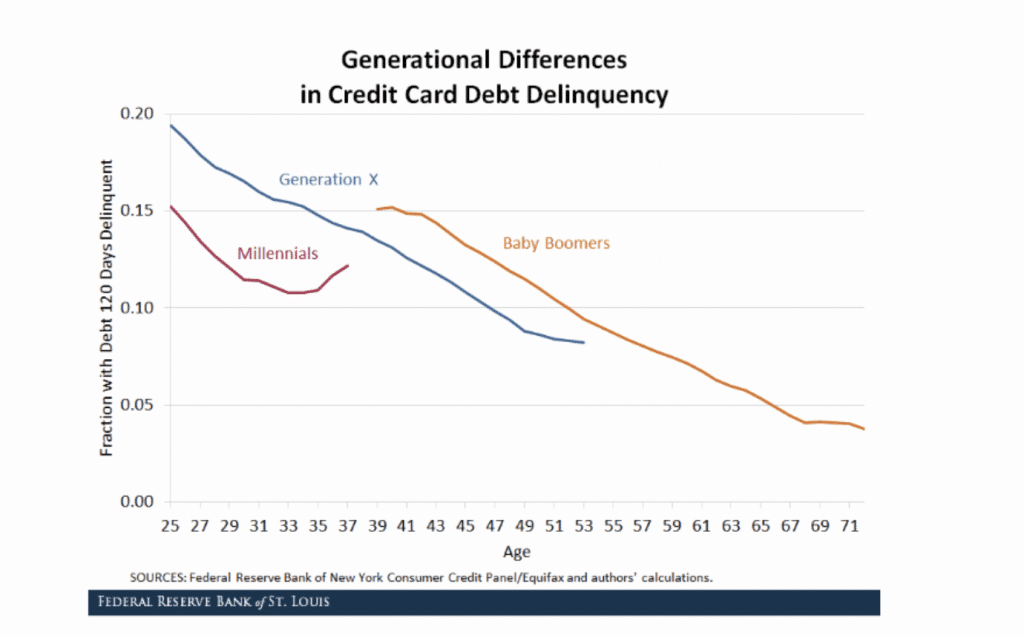
As shown, Millennials’ delinquency rates were almost 5 percentage points beneath their nearest counterparts for much of the sample, and Baby Boomers’ rates were the highest by a slim margin.
The financial advice site Credible conducted a poll of Millennials in late 2017 which may explain the generation’s relative trustworthiness when it comes to debt repayment: Millennials, the survey found, fear credit card debt more than either war or death.
Coming of age during a financial crisis may have resulted in a generation that takes finances more seriously than it gets credit for: slower to invest in traditional financial products, more prone to invest and more demanding of transparency, but also responsible with debt repayment.
Indications are the Millennials spend more time in school, which leads to debt, but also is an investment that improves productive and usually results in higher future earnings. With ample time to participate in the labor force, this generation should remain financially trustworthy.
SOURCES